We all enjoy food desserts but do we enjoy food deserts?
Food desserts are, of course, sweet courses or snacks. Food deserts, however, are low income areas are more susceptible to health problems because of unequal access to supermarkets with affordable and nutritious foods. Factors like transportation and the prevalence of fast food chains contribute to this food inequality experienced by many in the United States.
So, why does increasing food desert resources matter?
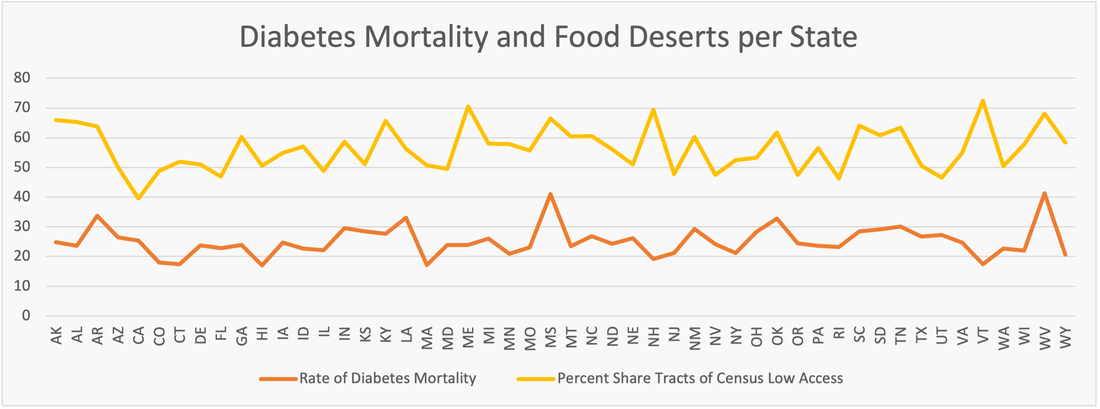
They lead to an unhealthy lifestyle and increase risk of mortality from diseases like diabetes in those living in affected areas. as you can tell from this graph, the rate of diabetes mortality (orange) is clearly higher in states with more food deserts (yellow). dollar stores/other cheaper alternatives are an appealing choice to those living in these food deserts because supermarkets are too far to access.
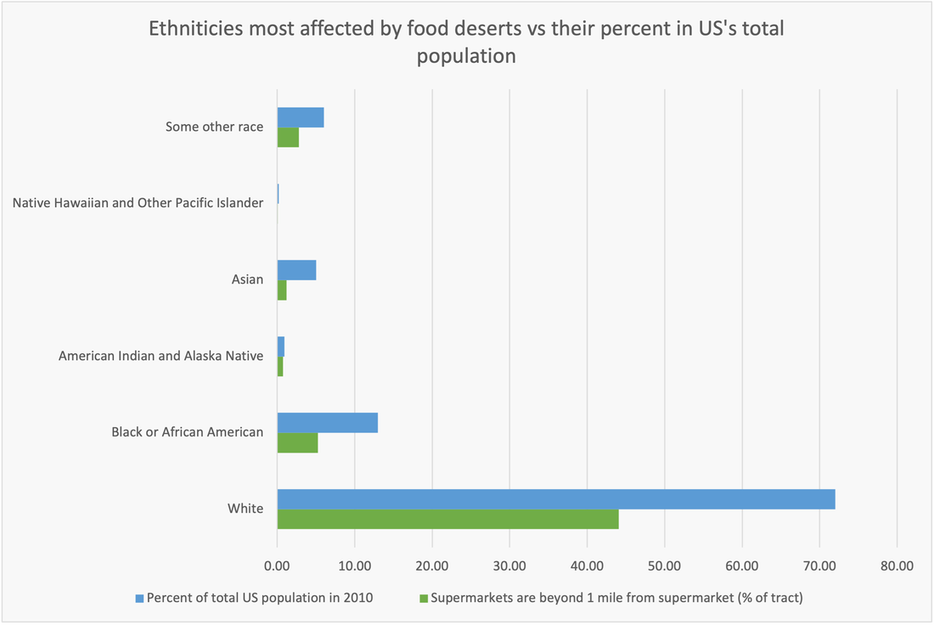
Food deserts also affect different Races differently and increase Racial disparities Throughout the united States. The above graph shows the prominence of each population in the United States (Blue) as well as the percent living in food deserts (Green). We can see that the more people of a certain race that live in the us, the more they are affected by food deserts. This data was pulled from the 2019 & 2010 census data and could be skewed due to sampling bias.
|
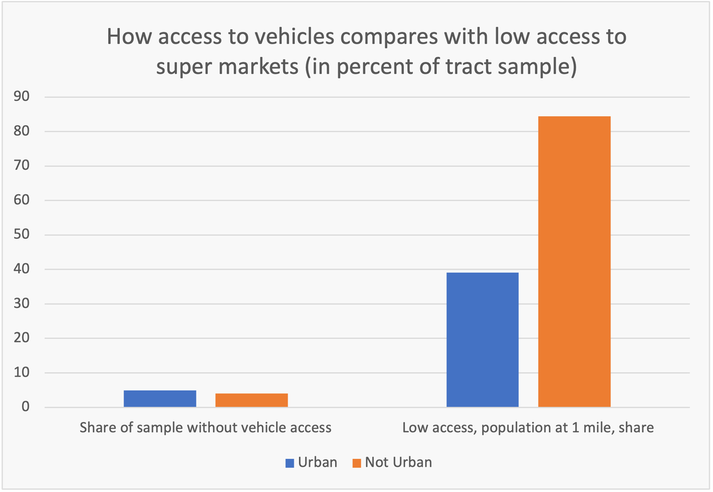
There are many factors that affect the prominence of food deserts in different parts of the country. One of these is urban vs rural areas. more people have access to vehicles in rural areas; however, there are more food deserts in these areas as people just live farther from shops/places they can get fresh, affordable food. Source: 2019 Census data
|

|

|
|
More Information About Deserts -
NOTE: The following data was pulled from the 2019 Census data. We understand that the census is not a completely accurate representation of the US population. Many African-Americans, Hispanics, and American Indians or Alaska Natives are undercounted while non-Hispanic Whites are overcounted. This could have affected the accuracy of our findings.
We were interested in examining the way food deserts impacted different groups of people. For example, perhaps if there was a large population of children in the same location there might be more government assisted programs to feed those children. This could affect the presence of food deserts.
|
Percent of Senior Citizens living more than a mile away from a supermarket |
Number of Senior Citizens in each state |
On the left is a graph of the percent of senior citizens who live in a food desert. We defined citizens living in a food desert to be citizens living one mile away from a supermarket. On the right is a graph of the number of senior citizens in each state.
You can see from the graph on the right that there are more seniors in states like California and Florida and less seniors in the general West and Midwest. In a state with few seniors like Alaska, there was a low percentage of seniors living in food deserts. While in California which had more seniors, there was around the same rate of seniors living in food deserts. Overall, there is not a clear correlation between the number of seniors and the rates of seniors living in a food desert.
|
Percent of Children living more than a mile away from a supermarket |
Number of Children in each state |
In the right graph, you can see how many states have a low number of children in their state with only two outliers: California and Texas. However, in the graph on the left, there is a much larger range of values. This would not be the case if there was a direct relationship between these two variables. This lack of a correlation is highlighted when looking at the two outlier states. California has a low rate of children living in a food desert while Texas has a more moderate rate. These rates can be found in many other states like Florida and Kansas which emphasize the lack of a correlation.
|
Rate of Low Income citizens in each state |
Percent of citizens living 1 mile away from a supermarket for urban areas and 10 miles away for rural areas |
The left graph depicts a larger percentage of low income citizens in the South. The right graph depicts the percentage of citizens living in a food desert. It shows how there are more people living in a food desert in the Midwest as well as the South. This seems to point to no correlation between these two values as states with wealthier citizens like Wyoming had a high percentage of people without access to a supermarket. However, most states in the South had a high percentage of low income citizens as well as had a high percent of citizens living in a food desert.
It is important to note that we analyzed our data on a very large scale which could have prevented us from seeing the true correlation of these variables.
It is important to note that we analyzed our data on a very large scale which could have prevented us from seeing the true correlation of these variables.
